Modelled Historical Data
Visit also the modelled historical data website, where you can download in csv format multi-year time series of meteorological fields from 2008 to 2010, with 2-km horizontal grid spacing and 10 min time resolution.
Navigation Help
The navigation interface is used to browse the numerical simulation results of the Wind Atlas in an easy and intuitive way. The maps page displays a global view of the fields calculated on all the Canadian territory. From there, a navigation tile by tile gives a more detailed view of the calculations by displaying the current tile in the central panel.
Navigation Menu
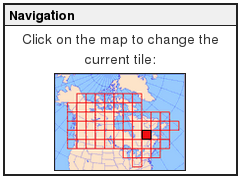
The small map represents the current tile's position on the Canadian territory. Clicking on another tile makes it appear in the central display. The four small arrows around the central tile can also be used to move about.
Field Menu
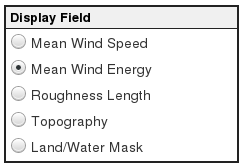
Contains the list of data fields from the Atlas that can be displayed in the central tile. The image is updated every time a new field is selected.
Field Description
- Mean Wind Speed: in meter per second. Represents the weighted average velocity for the current tile, based on the WEST models.
- Mean Wind Energy: in watts per square meter, also according to the model.
- Roughness Length: a value between 0 and 2, representing the height above the ground where the wind velocity, in theory, is equal to zero.
- Topography: elevation in meters, relative to the sea level.
- Land/Water Mask: index between 0 (sea) and 1 (land).
Height Menu
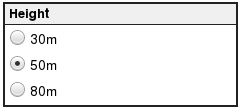
For the fields "Mean Wind Speed" and "Mean Wind Power", it is possible to display the results for 3 different heights. The default height is 50m above the ground which is a common height for wind turbines.

Period Menu
For the fields "Mean Wind Speed" and "Mean Wind Power", it is possible to display the results for 5 different periods: annual, winter (December, January, February), spring (March, April, May), summer (June, July, August), and fall (September, October, November).

Display Options Menu
It is possible to overlay various useful information on top of the field tiles, for better localisation. These options are also available in the corresponding high-resolution images. Please note that when an option button is grayed out and disabled, it means the corresponding option is not available for that tile.

Download and print Menu
It is possible to get the current map as an image in a higher resolution than the one displayed on the screen, in order to download or print it.
Zoom button
The "Zoom" button, located above the central map, is used to get the current map as an image in a higher resolution than the one displayed on the screen, making it easier to see the options, such as the name of the cities. Please note that, as opposed to the display by tile, this image shows the overlap with neighbouring tiles.
Overall map button
The "Overall map", located above the central map, is used to get the glabl map of Canada showing the field presently displayed in the central image, in order to get a global view of that tile among the others.
Values, wind roses, wind speed histograms, turbine formula at a point Menu
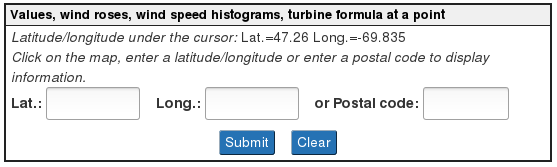
A click on a point on the tile displays a popup window with information on the nearest grid node: latitude, longitude, numerical values, wind roses, wind speed histograms, and the possibility to calculate the turbine formula by entering wind turbine data. Instead of a click on the tile, a latitude/longitude or a postal code can be directly entered by the user in this menu so as to display the same information for that location, or for the nearest point. Finally, the latitude/longitude corresponding to the point situated under the cursor is displayed at the top of that menu; the display is updated when the cursor is moved in the tile.
The popup window shows four tabs on which a click displays successively numerical values, wind roses, wind speed histograms, and a form to calculate the turbine formula.
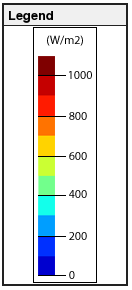
Legend
The legend shows the color ramp and the scale used for the field displayed in the central map.
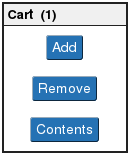
Cart Menu
The web site has an integrated virtual cart to choose interesting tiles for further downloading their associated data files, to analyse them or to run more complex simulations. The three buttons can be used to add and remove an item from the cart, or to go to the cart contents page, where it is possible to download the data files for the tiles that were previously marked. The number between parentheses in the caption represents the current number of items in the cart.

Tools Menu
The Help button leads to this help page.
Compare with real life observations Menu
It is possible to display a comparison of the results computed by the model to the real results observed at certain points of the tile. Please note that this comparison is done for the mean wind speed at a height of 10m.
- Date modified: