Values
Roses
Histograms
Turbine formula
Numerical Values at 30m
Latitude = 47.218, longitude = -66.468

Period Mean Wind Speed Mean Wind Energy Weibull shape
parameter (k)
Weibull scale
parameter (A)
Annual 5.30 m/s 129.62 W/m2 2.20 5.98 m/s
Winter (DJF) 6.18 m/s 195.25 W/m2 2.34 6.97 m/s
Spring (MAM) 5.18 m/s 124.12 W/m2 2.15 5.85 m/s
Summer (JJA) 4.65 m/s 82.06 W/m2 2.40 5.25 m/s
Fall (SON) 5.48 m/s 134.62 W/m2 2.38 6.18 m/s
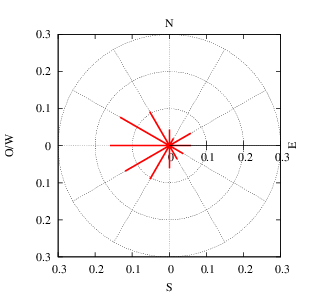
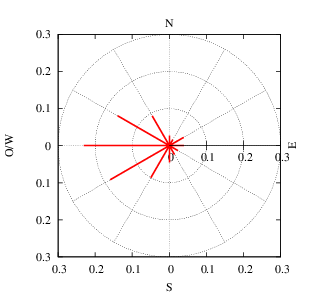
Wind Roses at 30m
Frequency distribution of wind by sector
Latitude = 47.218, longitude = -66.468

Warning: The first column of the wind rose files shows the wind direction computed in degrees starting from the east then rotating counterclockwise --> 0 degree = east, 90 degrees = north.


Annual
Rose Wind
Download the .txt file for the wind rose

Winter (DJF)

Spring (MAM)
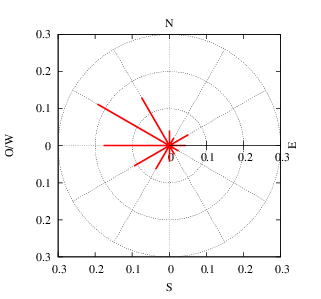
Rose WindRose Wind
Download the .txt file for the wind roseDownload the .txt file for the wind rose

Summer (JJA)

Fall (SON)
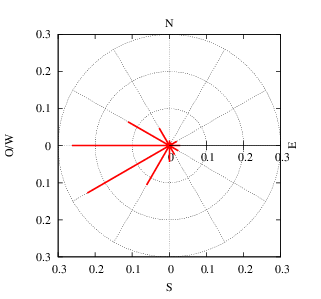
Rose Wind Rose Wind
Download the .txt file for the wind roseDownload the .txt file for the wind rose

Note: the maximum scale of the wind roses is of 0.3 in most cases, to allow a better visual comparison between the roses. However, when a value over 0.3 is found in a data file, the maximum scale is modified to reflect these higher values. Then a warning appears above the wind rose.
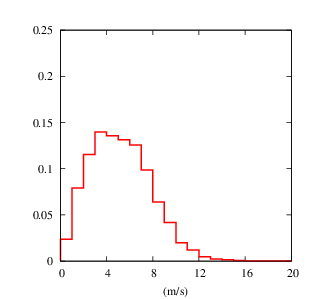
Wind Speed Histograms at 30m
Frequency distribution of wind by speed class
Latitude = 47.218, longitude = -66.468

Annual
Histogram
Download the .txt file for the histogram

Winter (DJF)

Spring (MAM)
Histogram Histogram
Download the .txt file for the histogramDownload the .txt file for the histogram

Summer (JJA)

Fall (SON)
Histogram Histogram
Download the .txt file for the histogramDownload the .txt file for the histogram

Calculation of the turbine formula for a given wind turbine at 30m
Latitude = 47.218, longitude = -66.468

Enter wind turbine data (all fields are required):